It is common to argue that there is a divide between critics and audiences.
Critics prefer arthouse dramas, preferably in black-and-white; audiences like things that go boom.
Thanks to countless explosions and few positive reviews, theTransformerssequels became alightningrodforthisargument.

Thankfully the answer is that good movies statistically do better at the box office.
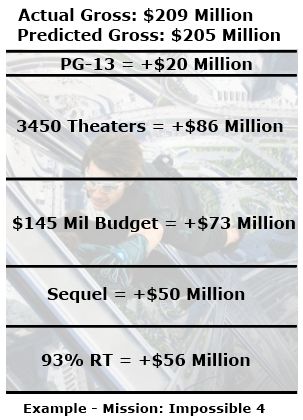
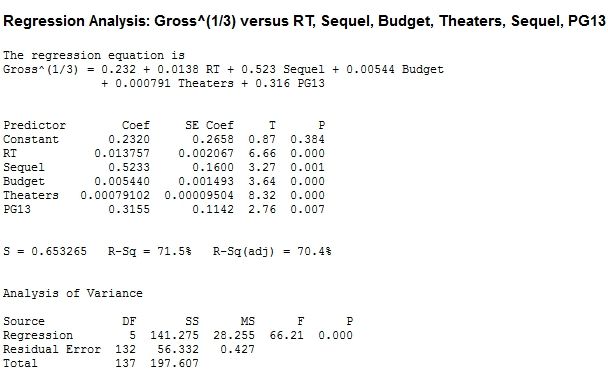
To incorporate other factors, I developed alinear regression model.
RT score) on the other side.
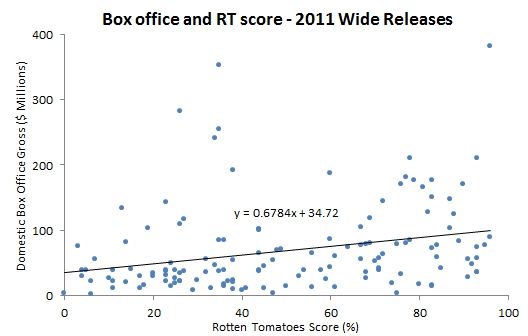
Image via Columbia Pictures
Ultimately, the above five factors lead to the best model that is also relatively explainable.
The regression analysis was conducted in Minitab using the 2011 wide releases.
The goal was to find an equation that would predict total domestic box office gross.
(In statistics, this is bluntly referred to asgoodness of fit.)
For the 2011 data, theR2for this model is 0.65.
There is no strict rule about what makes a goodR2.

Image via Columbia Pictures
So I consider this a good fit.
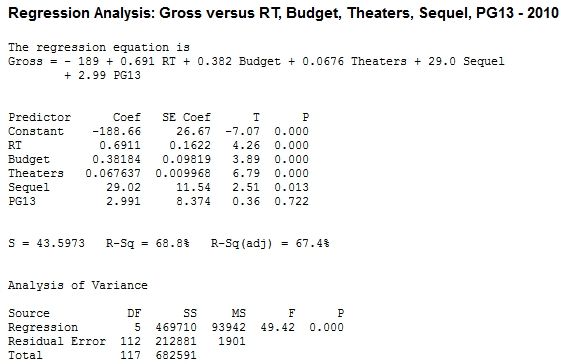
I tested this model on the 2010 wide releases for validation.
I explain in more detail inthe appendix, which is meant more for stats nerds than movie fans.
That may mean I am missing an important factor or need to tweak the model.
On the other hand, those could just be outliers that canat be predicted using basic data analysis.
Regardless, the bottom line is encouraging: studios have financial incentive to put an effort into makinggoodmovies.

All data comes from theThe Numbers,Box Office Mojo, andRotten Tomatoes.
I add a bit more commentary, and wanted to include this section to support the analysis.
But the heavy lifting of the interpretation is left to you.
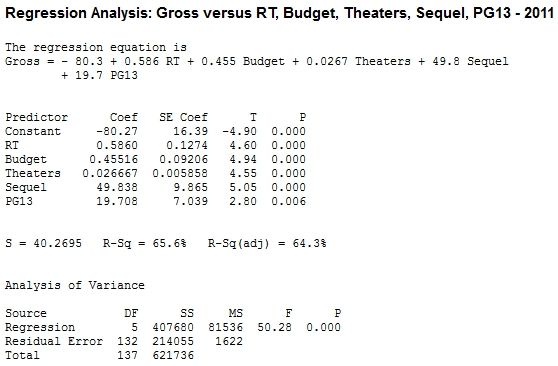
First, here is the Minitab output for both the 2011 and 2010 data sets.
Of course, these models donat satisfy the necessary assumptions.
There is no multicollinearity, and there is sufficient linearity.
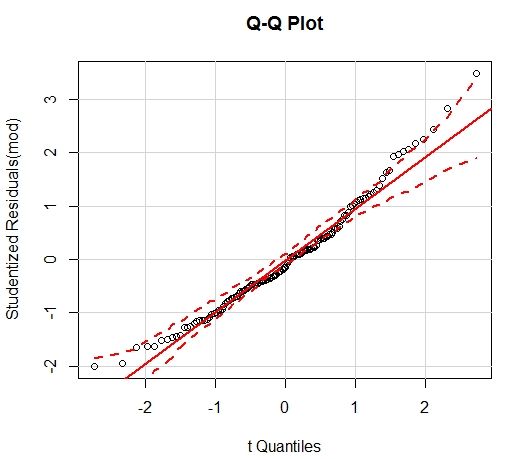
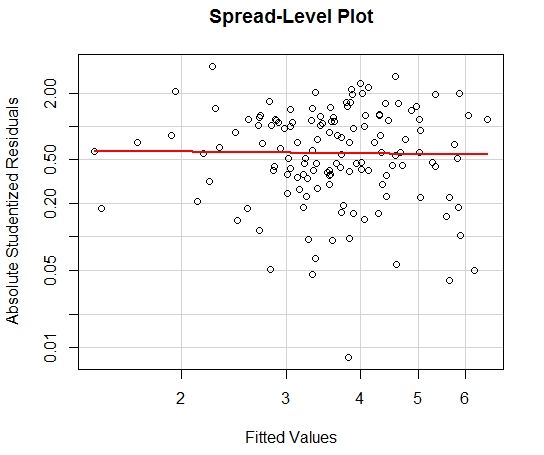
But the normality assumption is probably violated and there is definite heteroscedasticity.
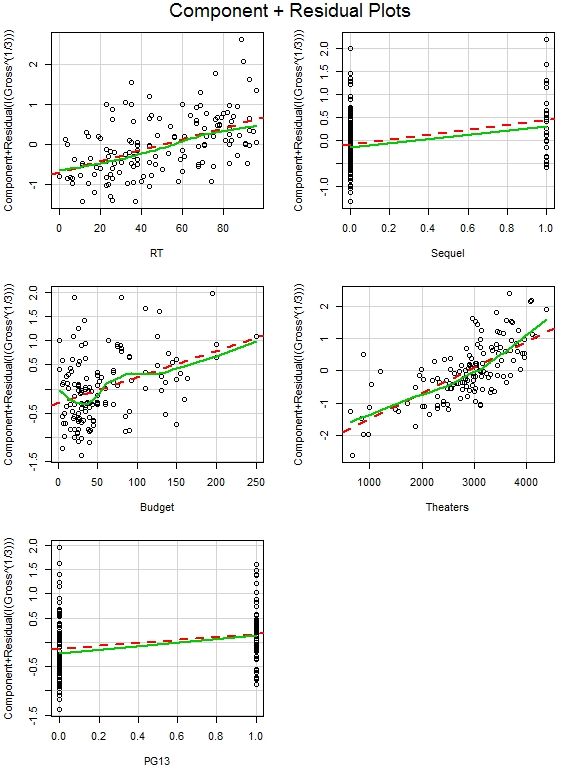
To counteract this, a transformation of the dependent variable Y^(1/3) is needed.
There is some benefit to using polynomial regression, especially with the theater count.
The Minitab output and relevant plots for the transformed regression model follows.